10 Employee Productivity Questions Vee Can Answer Instantly
Unlock instant insights into employee productivity with Vee, Visier’s genAI assistant. Here are 10 key productivity questions Vee answers instantly to boost workforce performance.
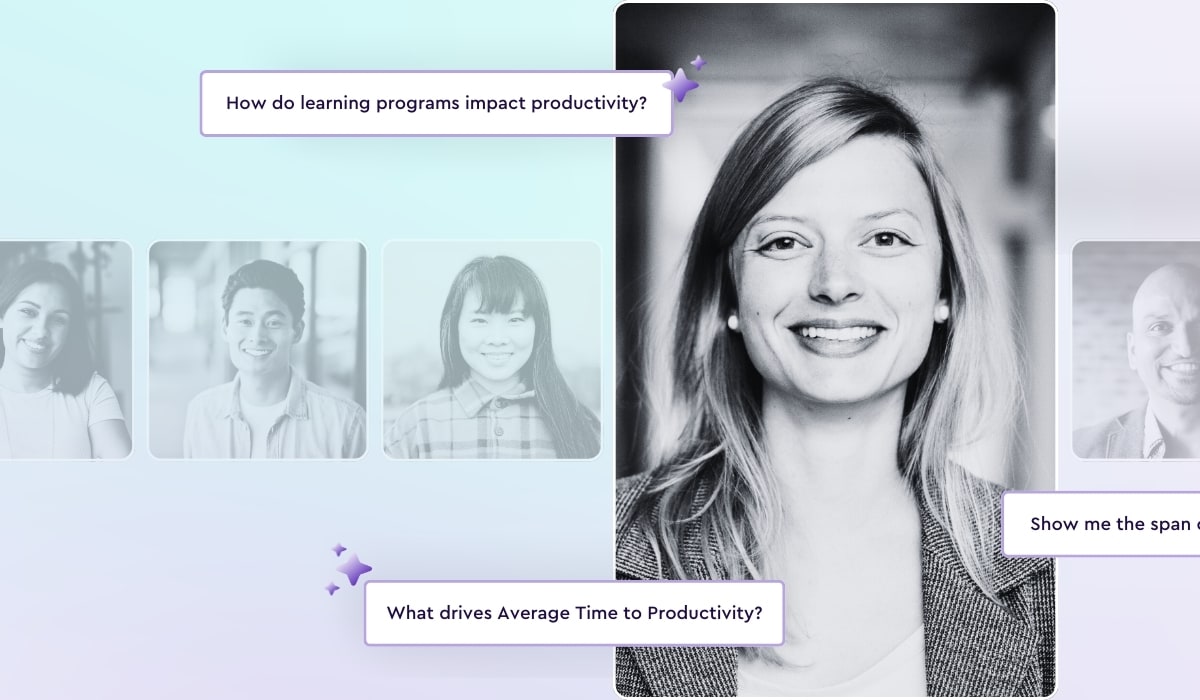
It’s really quite remarkable how rapidly technology has evolved to provide business and HR leaders and managers with at-their-fingertips access to information and insights into their workforce capabilities, gaps, and opportunities. With the help of artificial intelligence (AI), companies can gain a deeper understanding of employee and workforce productivity in a global economy, where labor shortages persist for many key roles.
Visier’s AI-assistant, Vee, can answer questions for users in seconds, helping them stay accurately and immediately informed of workforce trends and shifts.
Here we take a look at 10 key employee productivity questions that Vee can answer to give you a starting point for your own research. This is just the tip of the iceberg, though. Your ability to use people analytics to glean insights into a wide range of employee- and business-related issues is virtually unlimited.

1. What drivers increase employee productivity?
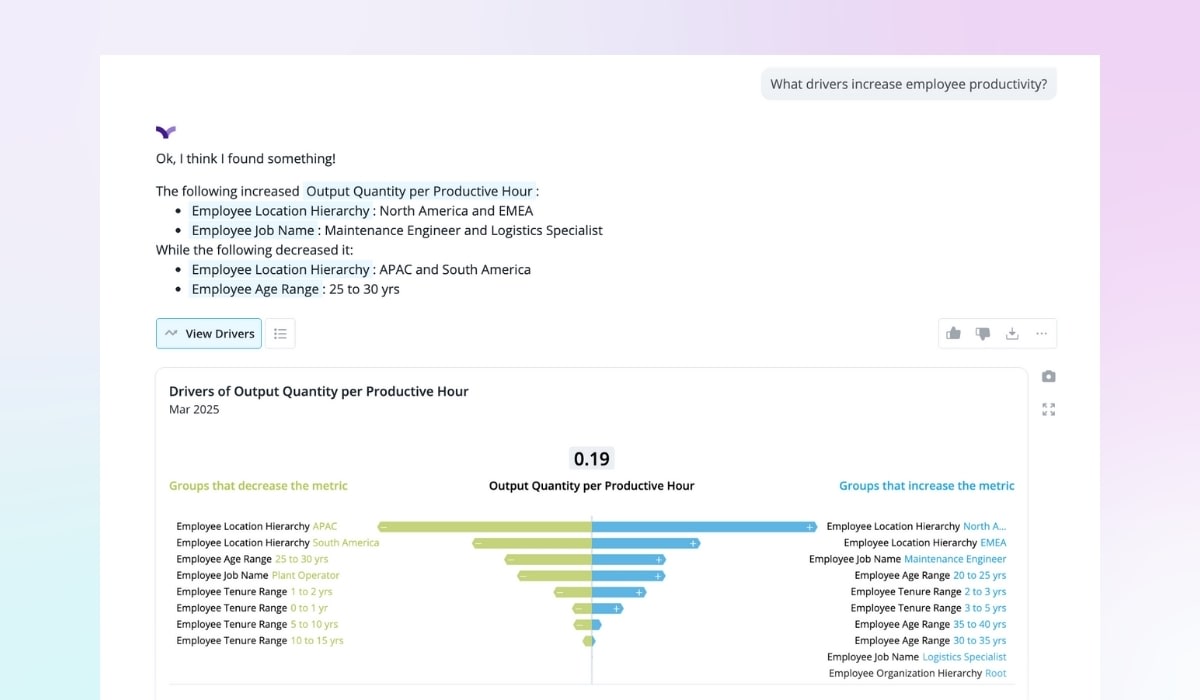
Understanding the factors that can boost employee productivity can help HR leaders and managers ensure that employees have access to the tools, resources, and support they need to be most effective, while removing barriers that may hinder their output. Variations in output based on employee location, age, tenure, and other factors can help companies identify both best practices and areas of opportunity for improvement.
Here we can see that employees in North America and EMEA are more productive than those in APAC and South America. Further, those in maintenance engineer and logistics specialist roles demonstrate greater output. These insights can help identify opportunities for intervention in under-performing areas of the organization.
2. What is output quantity per productive hour compared year over year?
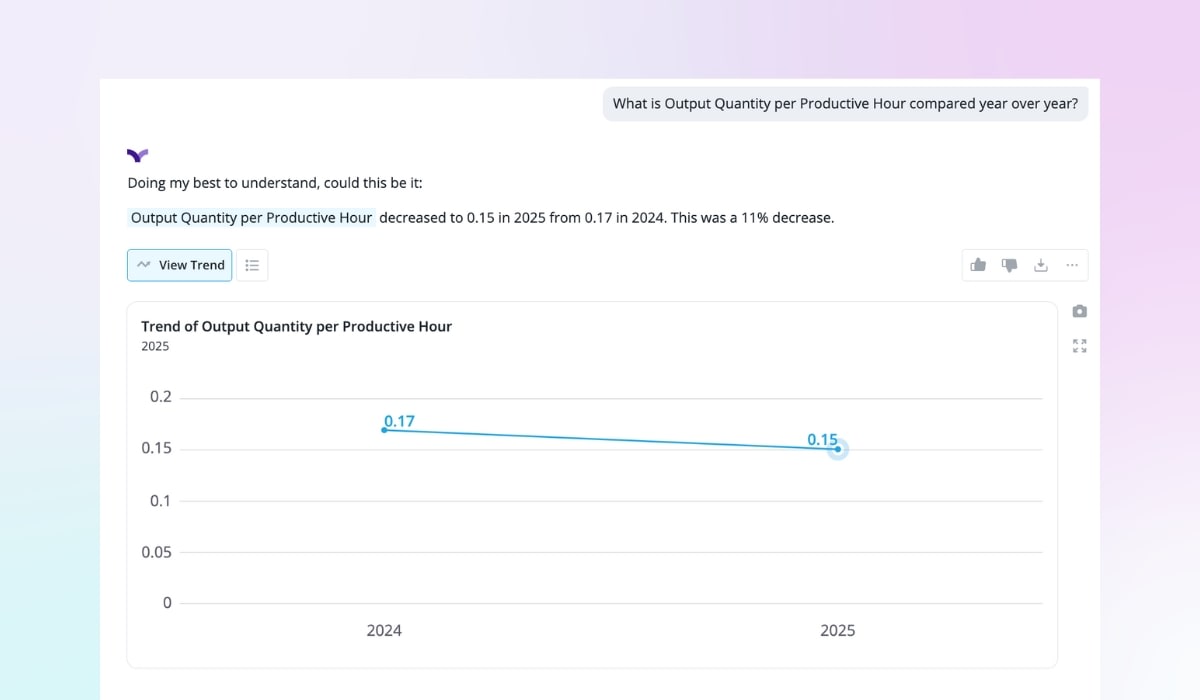
Tracking productivity trends over time helps organizations stay on top of shifts that may result in reduced output, offering the opportunity for intervention before situations become significant problems.
A year-over-year comparison can provide a critical performance indicator to help leaders investigate underlying causes—e.g., changes in processes, new hires who may require additional training, or a decline in employee engagement.
3. How does output quantity per productive hour compare to total scheduled hours?
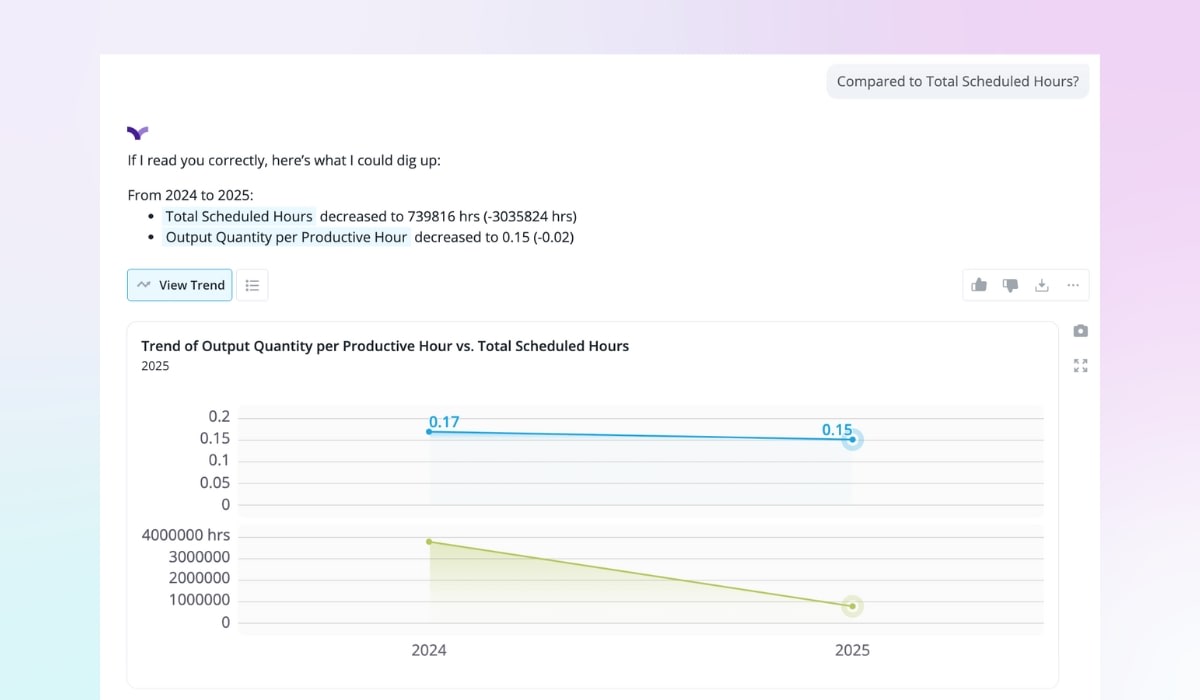
Evaluating the output from one question often leads to follow-up questions. Ask Vee a new question, or choose from one of the suggested follow-up questions to instantly drill deeper into the data. For instance, after detecting a decline in productivity, a follow-up question about how output relates to scheduled work hours can yield more nuanced insights.
In this case, we’re seeing a decline in two areas—total scheduled hours and output quantity per productive hour—suggesting a correlation between fewer hours worked and reduced output productivity. Visualizing the data in this way also helps to quickly identify marked shifts, as seen in the dramatic reduction in scheduled hours.
4. How do learning programs impact productivity?
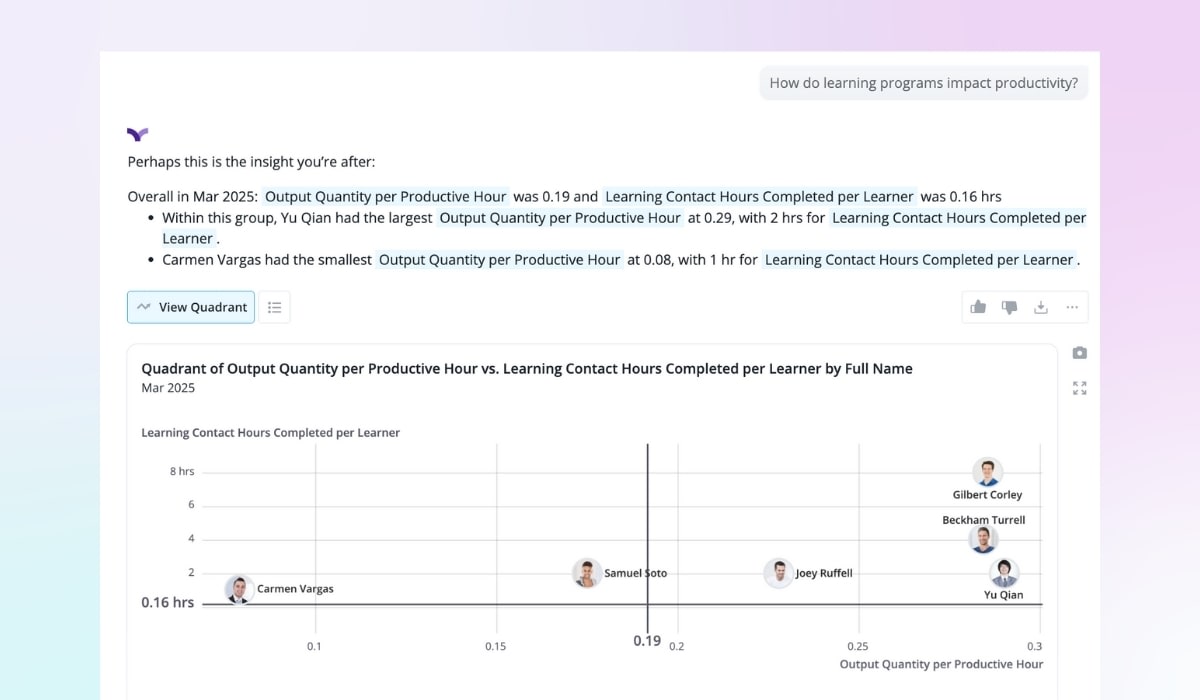
Companies don’t invest in learning and development (L&D) activities simply to address employee interest in professional development, although that is, of course, an important factor. They’re also interested in whether their often significant investment in training is having an objective positive impact.
Are our investments in training and development having a positive impact? Are certain programs achieving better results than others? Does impact vary based on employee attributes, such as length of tenure and location?
These are all questions that Vee can help explore, drilling down to the employee level. Here, for instance, we can see that Yu Zian had higher productivity and engaged in a higher level of training than Carmen Vargas did; Carmen also exhibited lower productivity than Yu.
5. How does average time to productivity in the sales department compare to the whole organization?
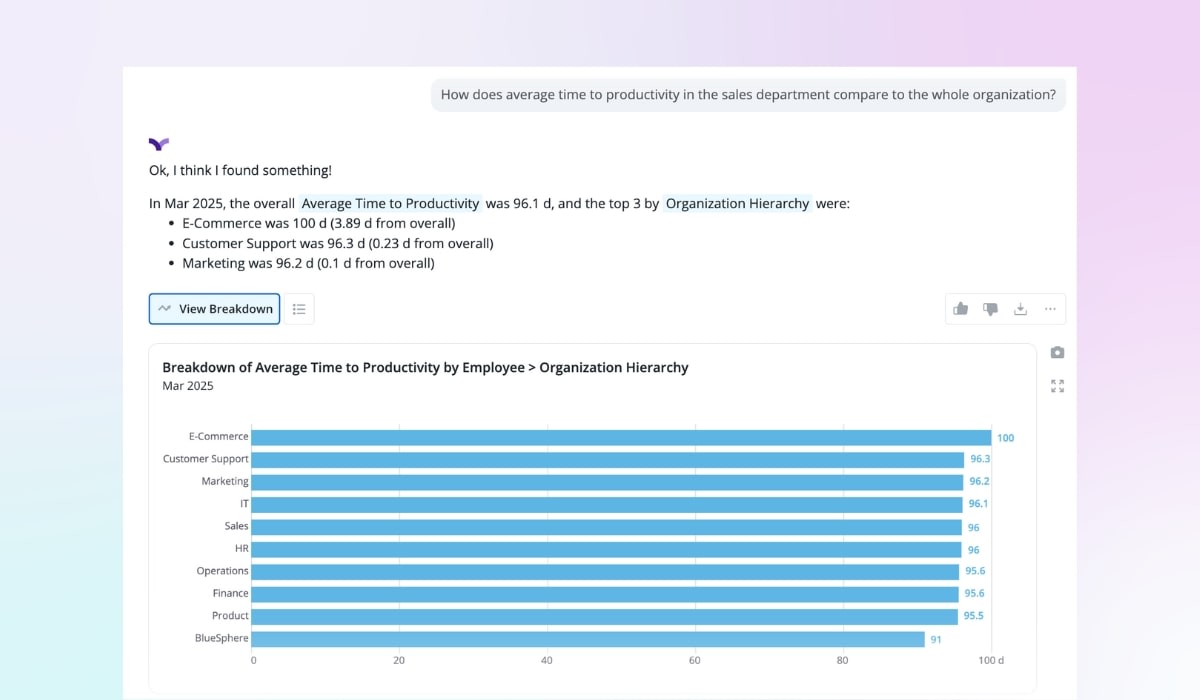
Productivity in the sales department has a direct impact on revenue and profitability. It is important to get sales staff up to speed quickly. Vee can help business leaders quickly determine how these employees become productive and how their productivity compares to other areas of the organization.
This type of comparative data can help companies identify areas where improved onboarding may be needed or where additional resources and support might accelerate productivity. Here, for instance, we can see that E-Commerce, Customer Support, and Marketing are showing the highest levels of time to productivity, above the average of 96.1 days.
6. What drives average time to productivity?
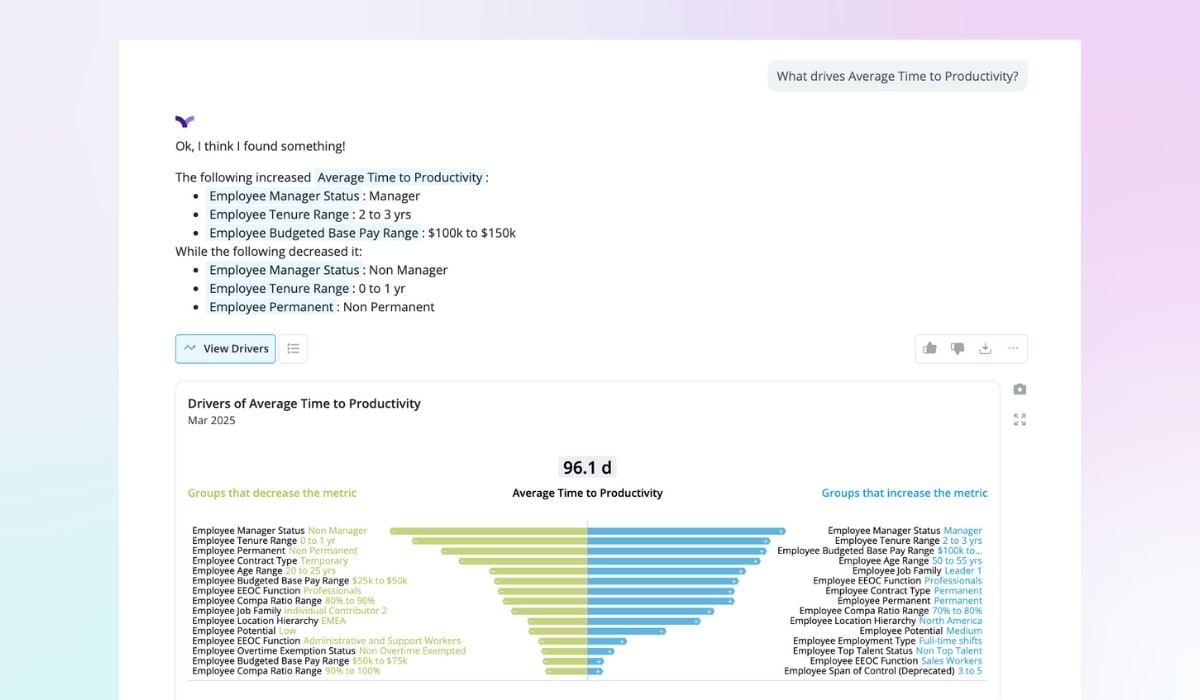
If we know that we’re seeing some discrepancies and lags in time to productivity between different parts of the organization, an obvious follow-up question might be related to the factors driving a decrease in average time to productivity.
Actual data can often defy conventional wisdom. Here, for instance, we might expect new employees to take longer to reach productivity than employees with 2-3 years of experience. This might prompt additional investigation to determine what factors are negatively impacting productivity among this group. Development programs can then be targeted to specific employee segments.
7. How does attendance impact employee productivity?
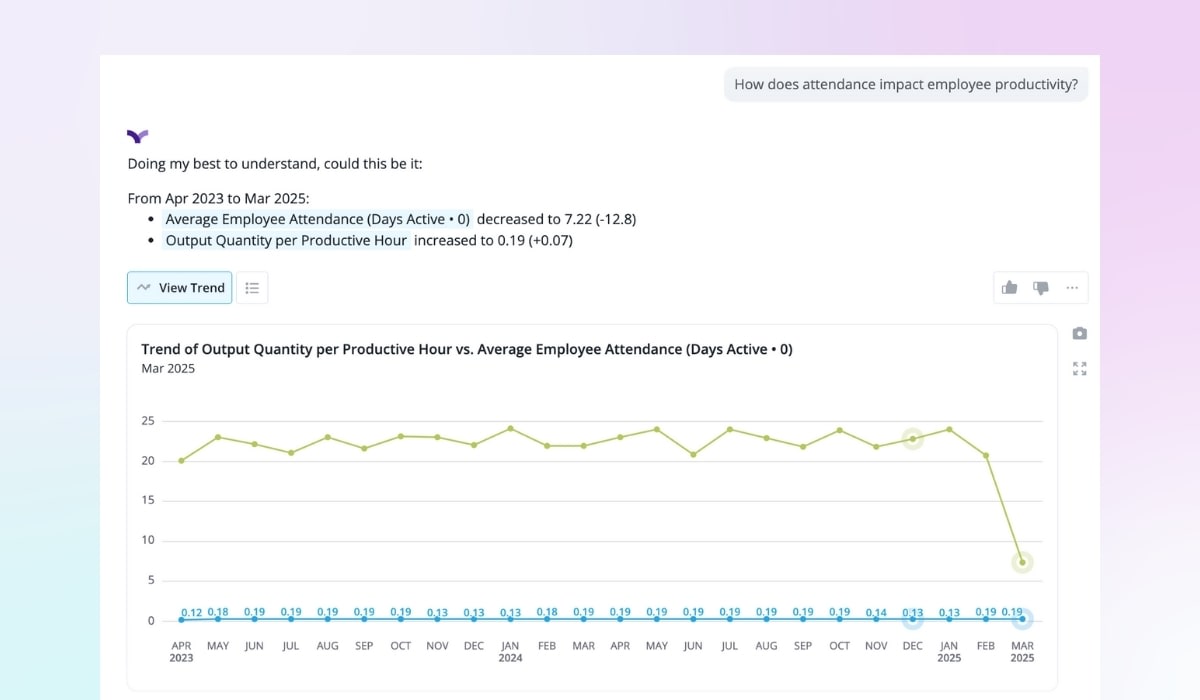
Understanding the relationship between attendance and productivity can help managers. Here we see another counterintuitive trend—an increase in output despite a decrease in attendance.
Could this mean that employees working from home are more engaged and, therefore, more productive? That’s a critical insight and data point for HR leaders and managers to have, in especially in a contentious era of return to work (RTW) mandates.
8. How does manager effectiveness compare to time to productivity?
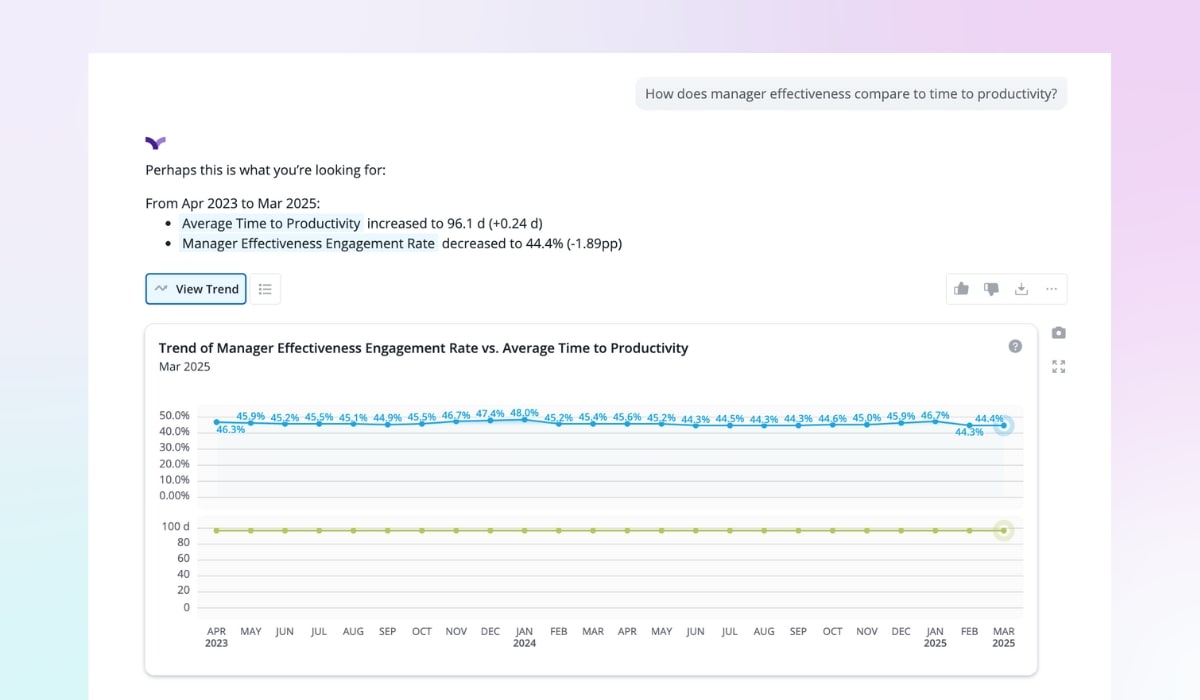
While the data shown here isn’t counterintuitive, it might suggest the need for additional focus on manager effectiveness—more training, onboarding support, a greater emphasis on employee development, etc.
Being able to point to quantitative impacts from these efforts in reducing time to productivity can help L&D leaders support investments in these activities. This data could also help spur discussions about hiring criteria for new managers and potential areas of focus for internal upskilling and reskilling for managers.
9. How does actual TCOW compare to budgeted TCOW?
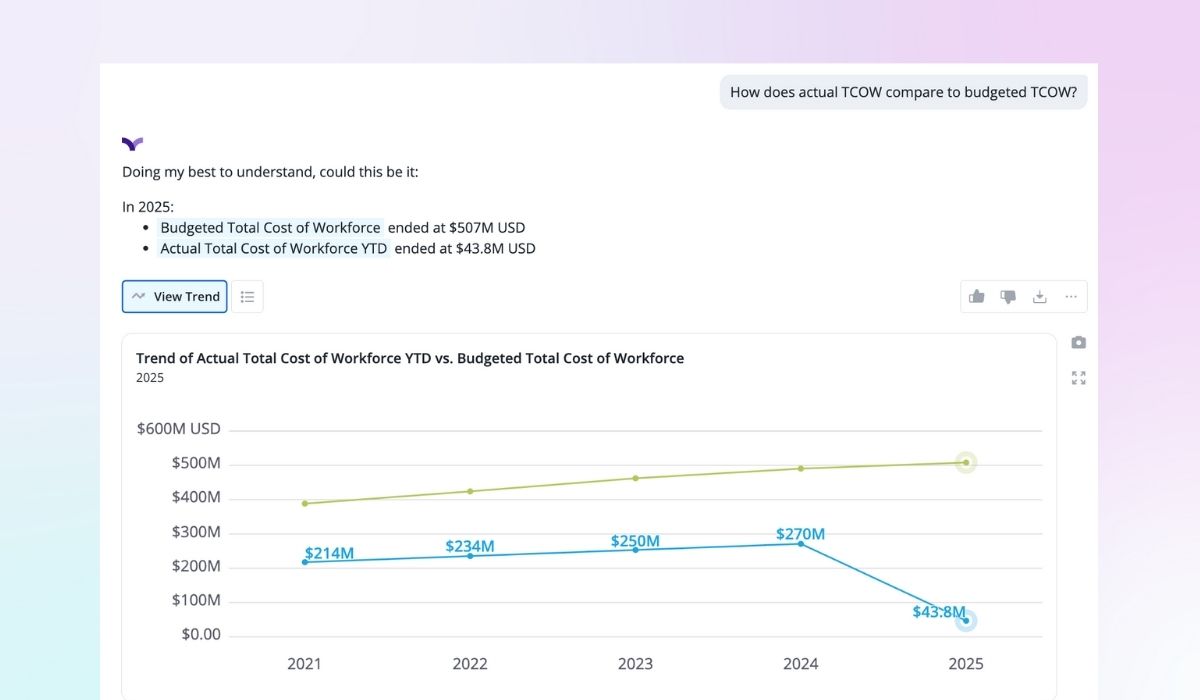
Total cost of workforce (TCOW) is a measure of all of the expenses associated with an organization’s workforce—how much they’re paying for employee contributions to the bottom line. This typically includes sales and wages, benefits, taxes, as well as training costs, and the cost of contingent or contract labor.
Each year, most organizations budget for their workforce-related expenses. Understanding how well their budget aligns with actual investments can help inform future planning cycles while also indicating where they may not be getting a positive return on this important investment. Identifying and analyzing cost variances can help companies make more informed decisions related to workforce planning and resource allocation.
10. Show me the span of control in the sales organization.
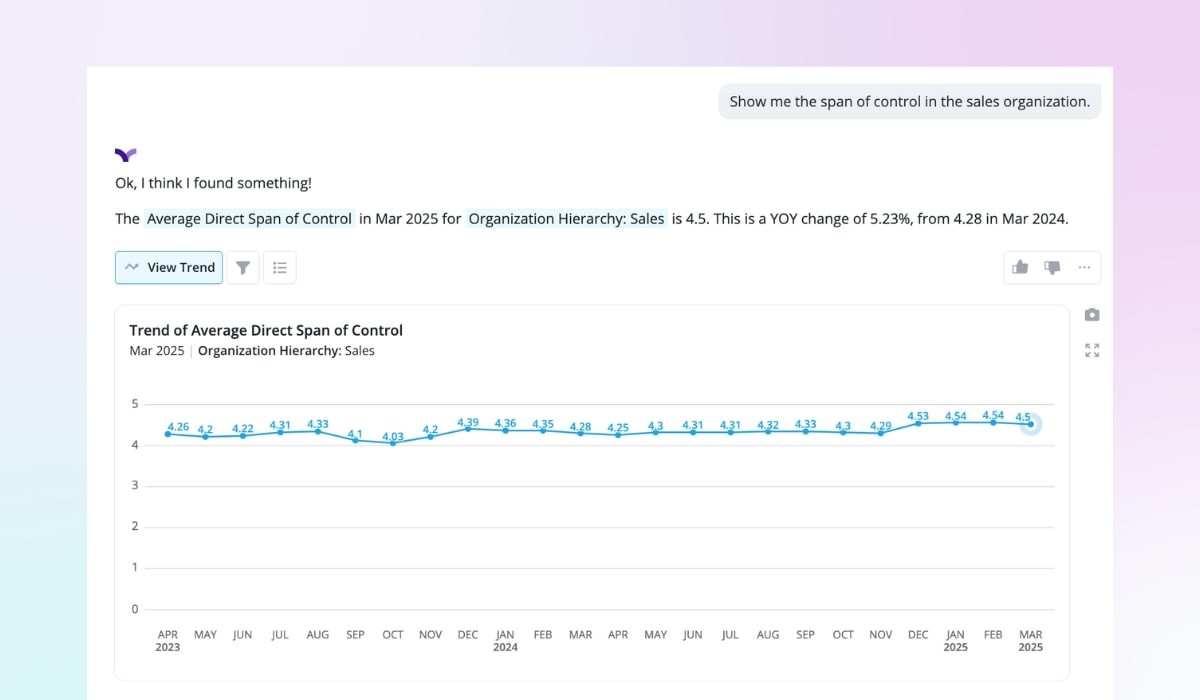
The span of control is a measure of the number of direct reports each manager is responsible for. Managing span of control to ensure the most cost-effective number of direct reports managers should have can both help control labor costs and positively impact productivity and employee engagement.
Examining the span of control for specific departments, such as sales, in this example, can provide valuable insights into where adjustments should be made in reporting relationships, identify areas where growth may be challenging for managers to manage effectively, and offer important guidance for workforce planning.
Evaluating the correlation between span of control and productivity changes can identify specific areas within the organization that require attention.

Today’s business leaders and managers have access to unprecedented real-time data that can be used to better manage their workplaces and drive greater productivity and business success.
Vee, Visier's genAI assistant, transforms how business leaders access productivity data by instantly answering critical workforce questions. No more waiting for reports or complex data analysis—just ask a question in plain language and get immediate, actionable insights.
The questions provided above should give you a good starting point. We encourage you to continue experimenting with Vee on your own to see how powerful a dedicated AI assistant can be.

