Why HR Dashboards are Just the Start
Organizations can’t get ahead by relying only on HR dashboards. Find out why Visier’s people analytics solution provides better benefits.
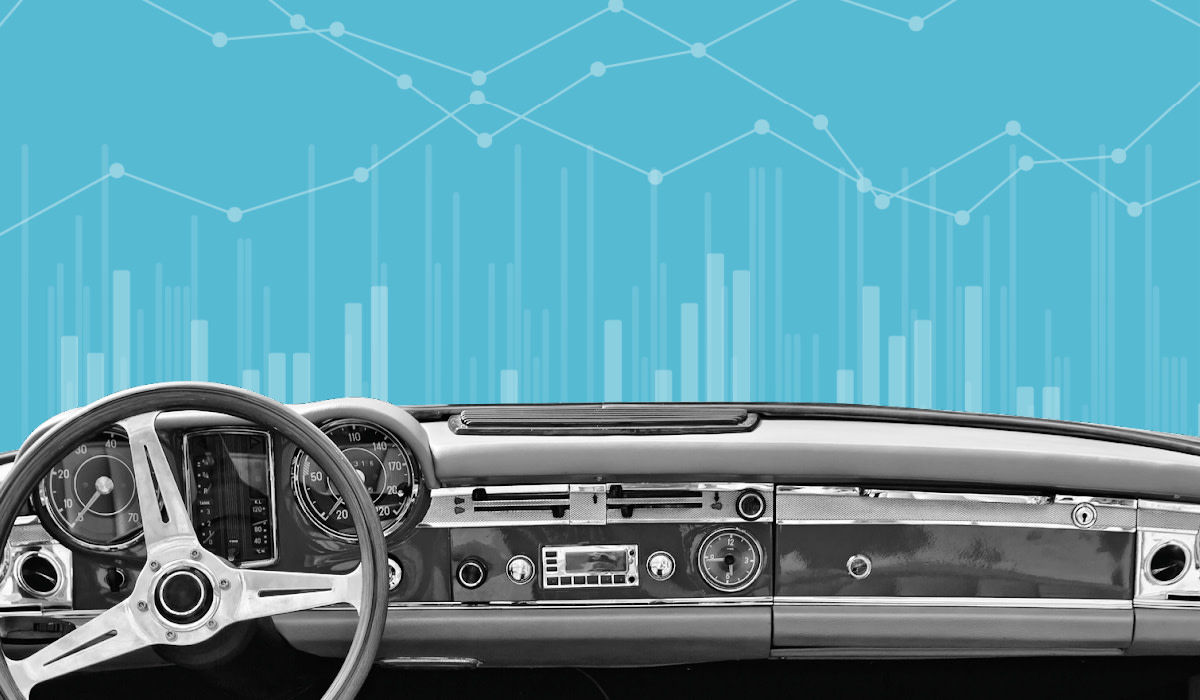
For many types of data, dashboards are good enough. But for people analytics, organizations need to go beyond an HR dashboard. Think of the dashboard in a classic car: It tells you how fast you are going, if you have enough gas, and whether the engine is having critical issues—but it doesn’t tell you where you’re going, why you’re going there, and if there’s a better destination.
People data dashboards all function more or less on the same model. You build integration with a data source and reveal it on an HR dashboard. Have a question about the data? Apply a filter. If that doesn’t answer the question, you’ll have to create a new dashboard.
Organizations today need to embrace a more agile approach and have the ability to fully explore the data. When it comes to people data, HR dashboards alone won’t help organizations move beyond an understanding of what’s happening right now. Predicting the future and informing leaders on the best course of action, for example, requires breaking the mental model of a dashboard and becoming more proactive.
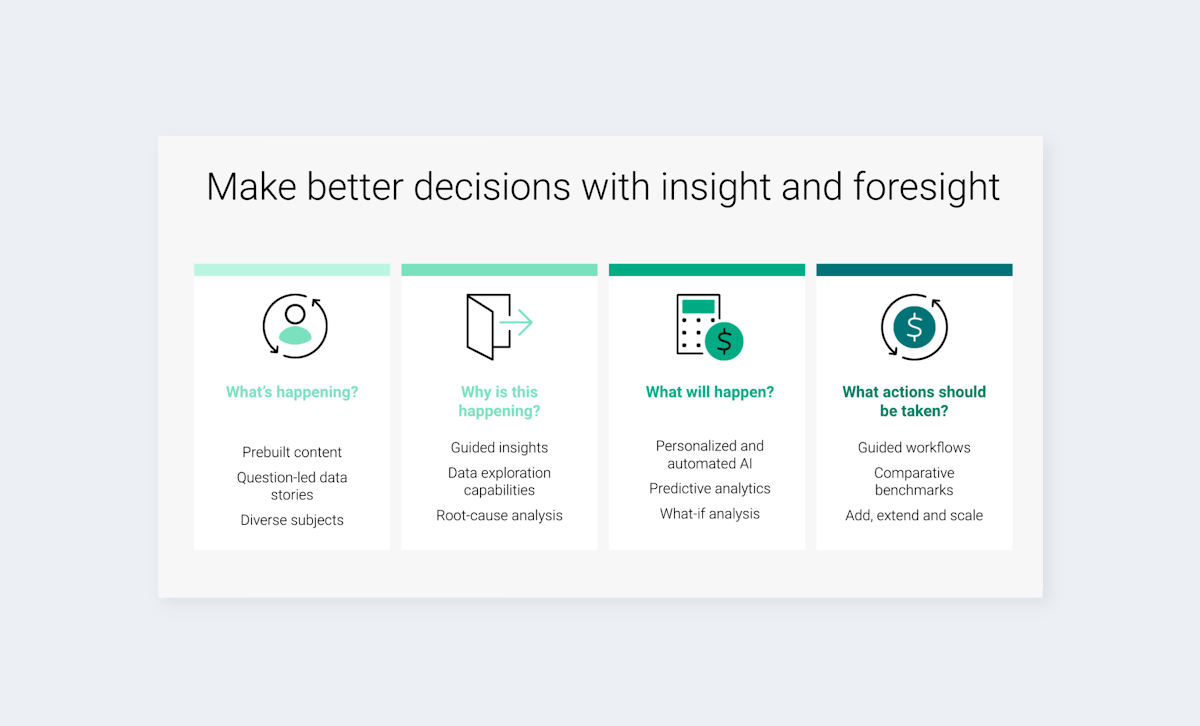
Knowing what’s happening is only the first step in making better decisions.
Why people data isn’t made for HR dashboards
People data is everywhere. It’s both scattered within your organization and outside your walls through market and industry data. In fact, on average, considerably less than 10% of relevant people data can be found in your HRIS. HR dashboards just can’t show the breadth of this data the way a people analytics solution can. Effective people analytics requires combining all this data for an aggregate view.
Here are some of the unique features that make people data different from marketing, sales, finance, or other HR and business data:
Sensitive: People data is some of the most sensitive data in the organization, subject to specific rules and regulations that vary by country. Employee data requires a system designed with built-in security features to protect privacy.
Multi source: A multitude of systems gather and house people data, including healthcare management systems, talent acquisition platforms, employee engagement software, payroll providers, and even multiple copies of these from mergers and acquisitions. Even organizations whose HR departments use a single vendor will still typically have non-integrated tools in their tech stack.
Longitudinal: Measuring impacts and trends over time requires a longitudinal view. For example, if you start a leadership development course, it may take several months to see an impact in the data. Retention measures, such as a pay increase to critical talent, may take six months to a year to show results.
Complex: People are complex, and so is people data. Understanding the nuances of people requires looking at their data from different perspectives. For example, deciding if you have the right skills for your workforce for next year requires information about what skills are present, the skill requirements of anticipated projects, headcount, and a host of other factors which require more than just one or two dashboards.
The limitations of dashboards in HR data analysis
Dashboards present information in a visual and dynamic way, but employee dashboards will only show you the “here and now” with a specific lens. There are an infinite number of possible questions requiring answers in order for leadership to act, and dashboards can’t cover every single option and choice. While filters offer some flexibility, they don’t allow users to explore related or tangential information without building a new HR dashboard.
Even with an unlimited bandwidth to build dashboards and reports, you can only build the ones someone thinks to build. People issues such as retention, diversity equity and inclusion (DEI), and employee engagement have complexities which may not be obvious at the outset. Sometimes you only know to look when the data reveals an anomaly.
For example, you may look at retention data for women over a year and see a spike in a specific department. That will lead to another question about the cause of that spike, which would require an employee dashboard about the demographics of that department. But without seeing the initial data, leaders wouldn’t know to look at that department. Questions beget questions.
How Visier’s people analytics breaks you out of the dashboard realm
Visier’s products are built for on-the-fly exploration in a way dashboards can’t match. This flexibility to truly understand complex issues lets organizations move from insight to action. Visier also evolves over time, constantly releasing new features that improve insights. As organizations change, their concerns change, and Visier changes to match.
Moving beyond dashboards opens possibilities. To illustrate this people analytics journey, let’s take a step-by-step exploration of an example around resignation.
1. What’s happening with turnover?
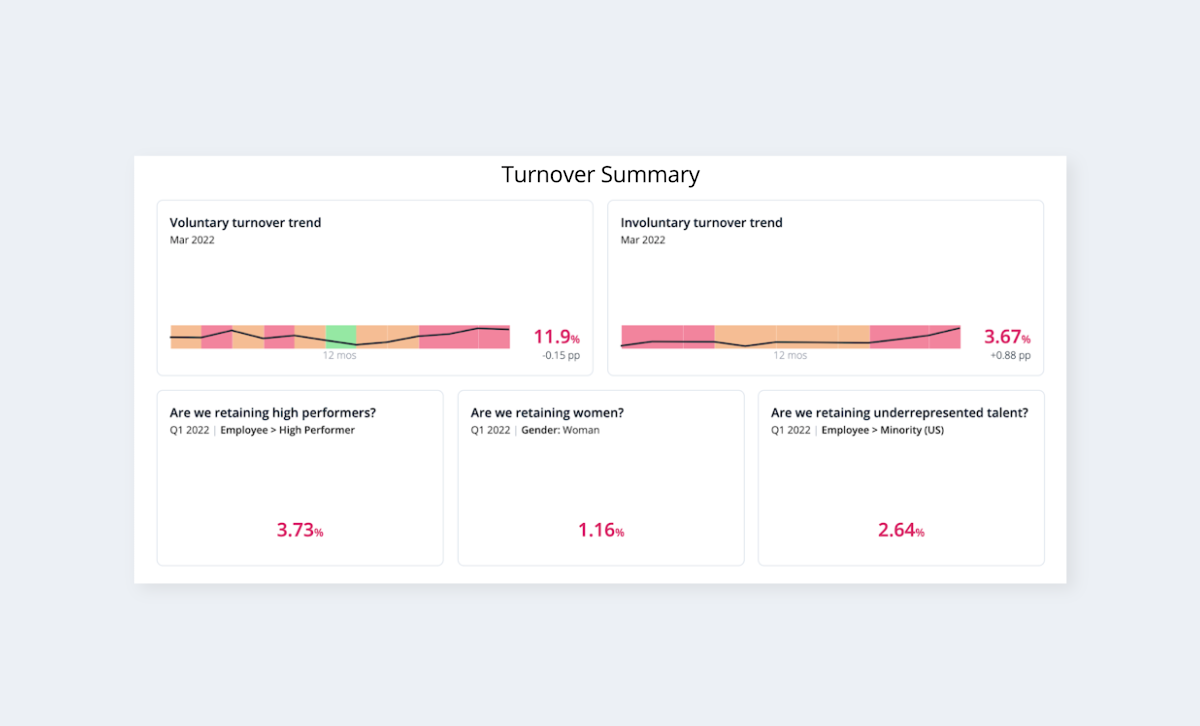
A snapshot of the current turnover situation.
The above summary doesn’t just show the turnover retention rate, it encourages easy exploration of the data without additional time, dashboards or preparation. Everywhere you go, the program offers indications to dig deeper. Comparing any metric or visualization to another is always just a click away.
2. Why is this turnover happening?
A benchmark comparison with the rest of the industry can be a great starting point to find out if your organization is seeing similar patterns or experiencing the same issue differently. Visier’s benchmark library gives you access to compare on geographies, organization size, employee demographics, and more.
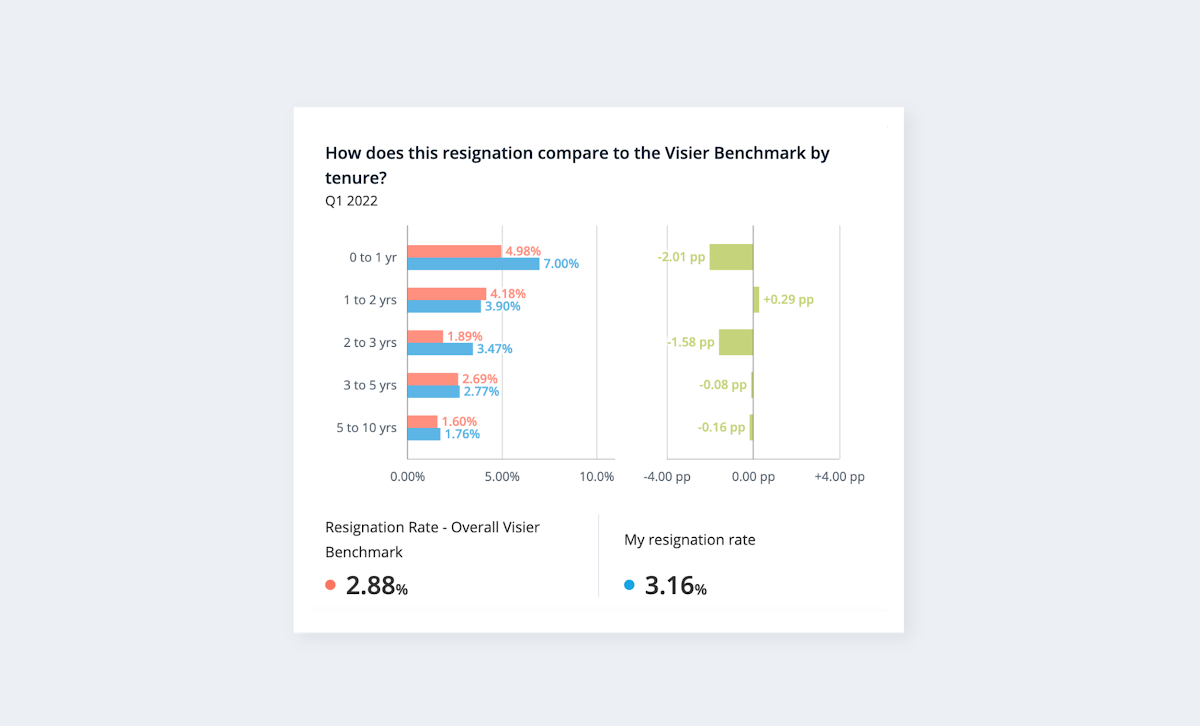
Comparing with industry benchmarks provides a good starting point.
The insight above is that this business unit is experiencing resignation at a greater rate than the benchmark, especially among new hires—a critical population in the organization. An employee’s onboarding experience can influence if they stay or leave past the first 90 days, so that’s one aspect to consider. Next, you could see what the exit surveys say.
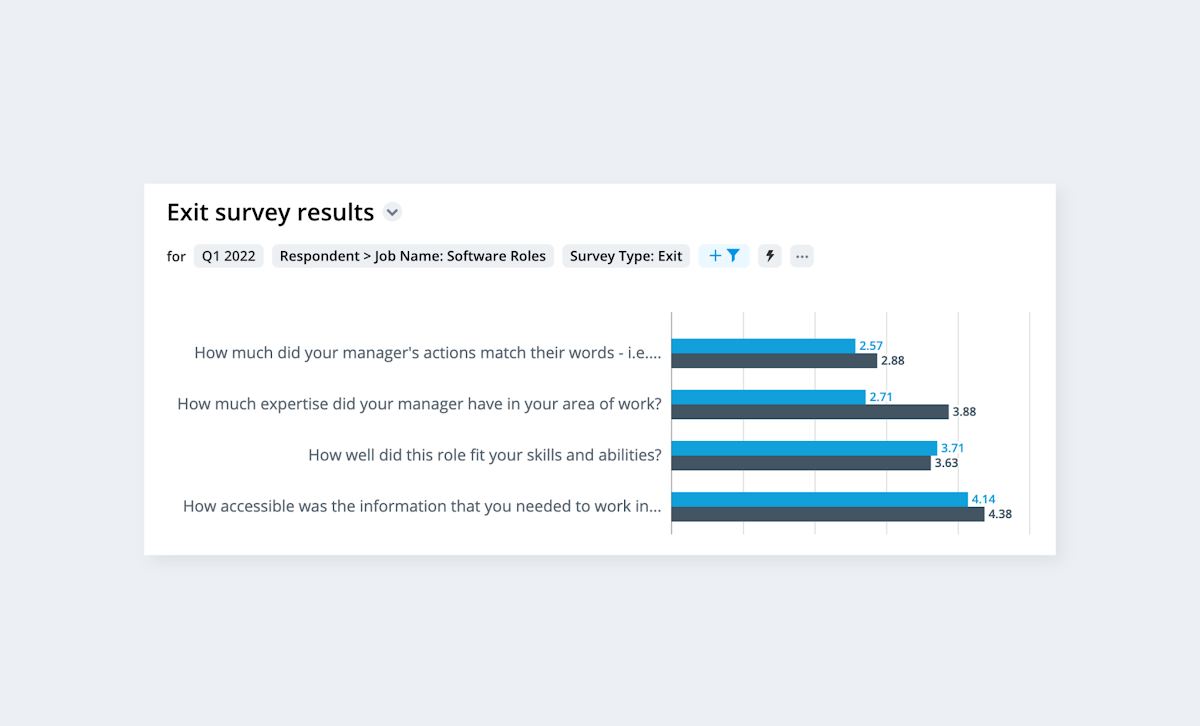
Exit surveys offer a chance for employees to state their reasons for leaving.
Employees may not always be fully transparent about their reasons for leaving. They may want to avoid burning bridges, or there may be multiple reasons that caused them to leave. In the first example, both career growth and compensation were major issues for some recent resignees. Keep this in mind as you explore further.
Here’s an example of an insight generated by the Visier application around what could be driving this turnover:
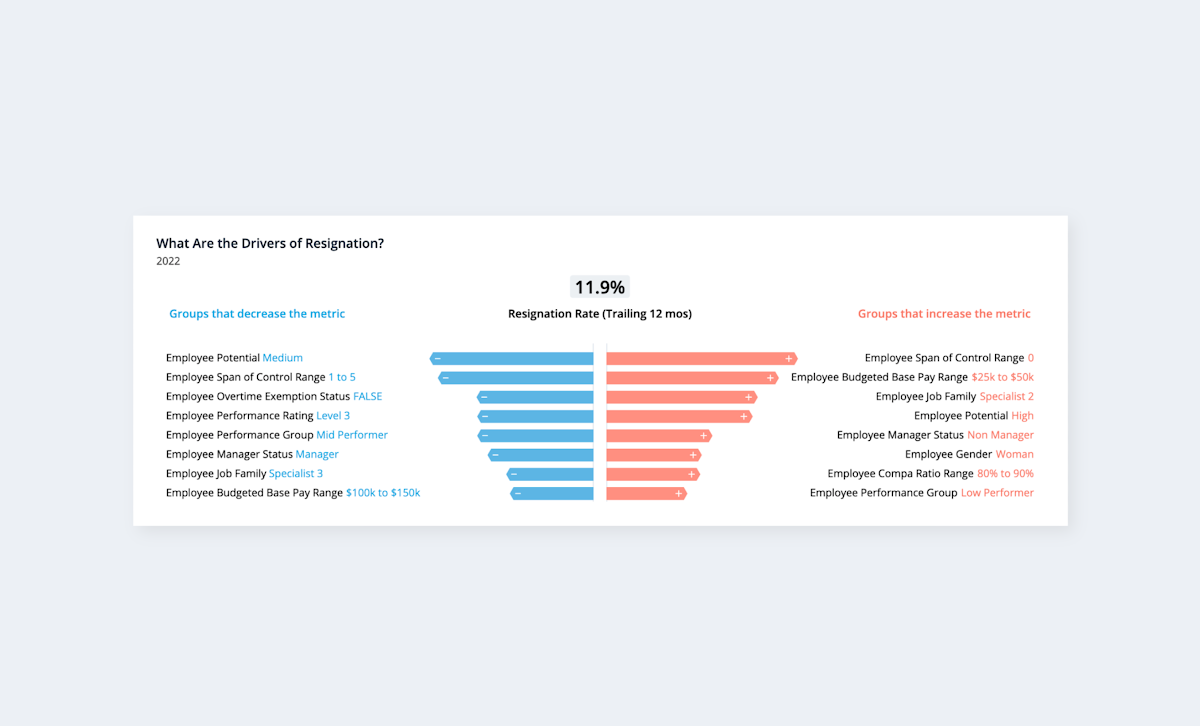
This chart indicates which attributes most strongly influence resignations.
This visual of drivers highlights the common characteristics of those leaving that are driving the resignation rate up (right side). In my example here, I can see that the most common characteristics of those resigning are high potential, non-managers paid below the midpoint in their salary range. Most organizations wouldn’t want to lose these people! I could address the challenge through targeted pay increases and career progression discussions. This aligns with some of the survey results as well.
3. What happens next?
The three charts in the visual below show different aspects to investigate. First, a prediction of who is likely to leave and who needs to be replaced.
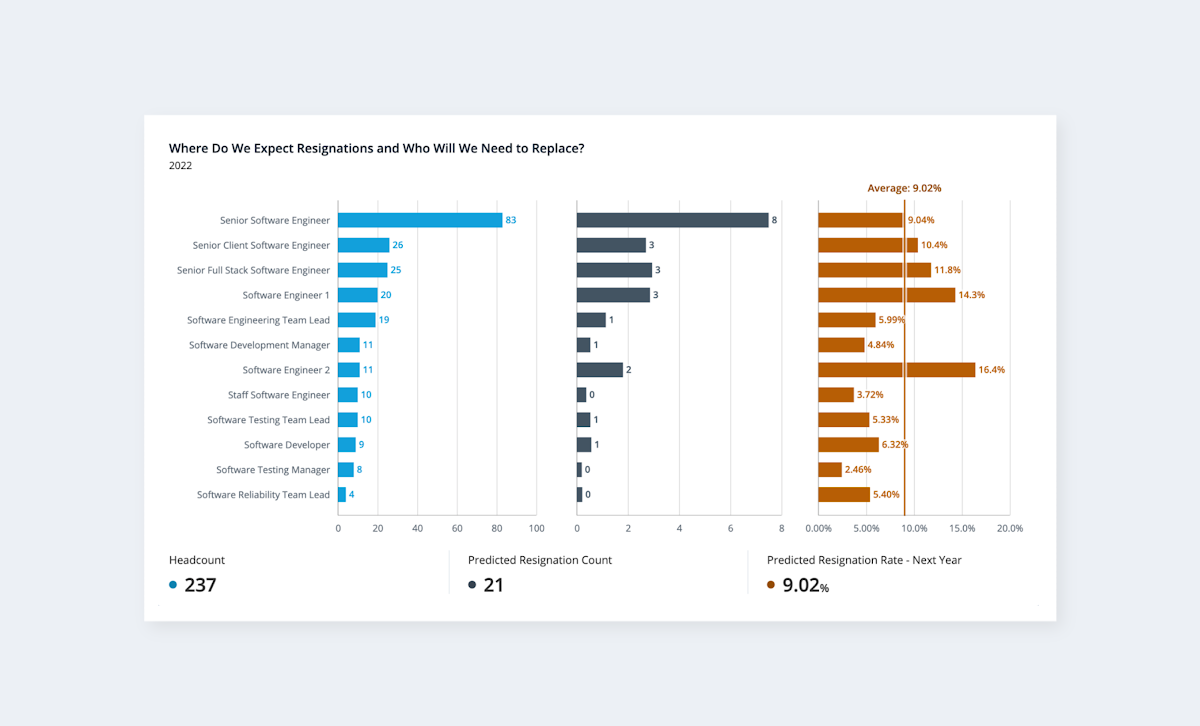
Visier’s predictive analytics capability is a differentiator in the industry.
Once you have an insight around where turnover is occurring, the next question is to determine what could be causing it, who might be at risk, and most importantly, what action can be taken to address it.
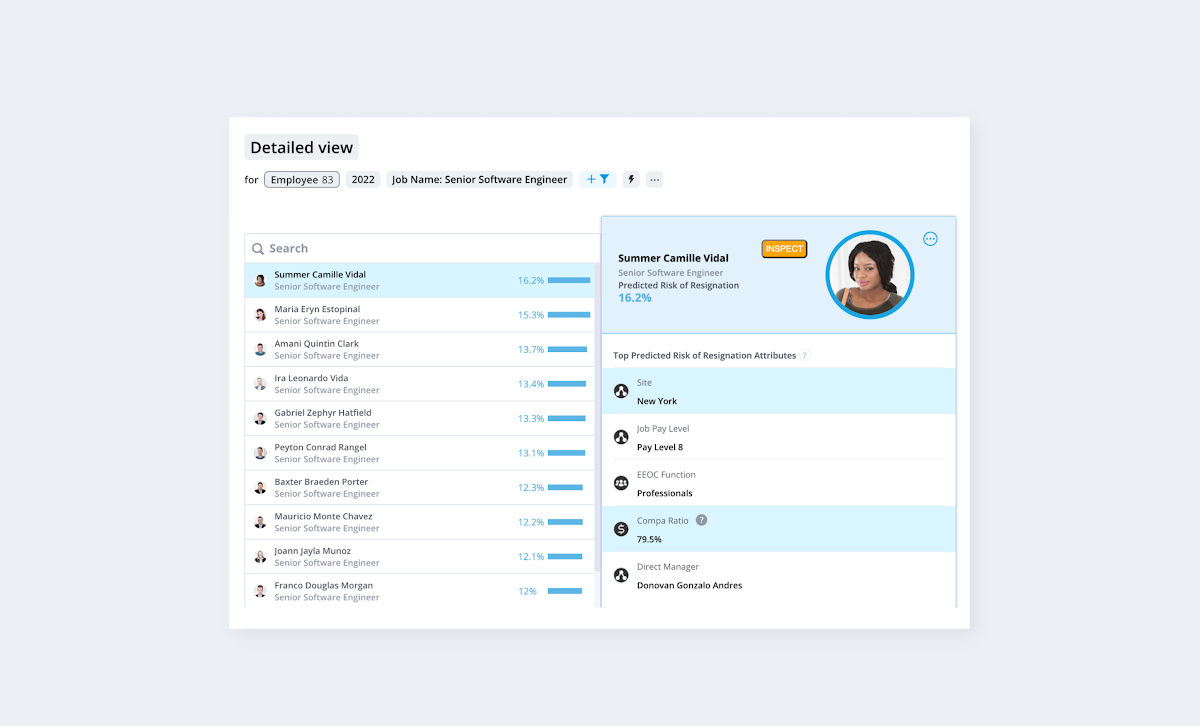
Visier’s granular analytics can show you which individuals have the highest risk of attrition.
This granular level of analytics shows you which individuals are at highest risk of attrition. The next question is how we might think about addressing it. Using the data earlier where exiting employees expressed concerns around development and career opportunities leads to the next obvious question: Where might these employees go within the organization?
4. What should we do about this issue?
To answer this question, you’ll need to understand the past. Look at the career progression not just of individuals, but of others from similar roles.
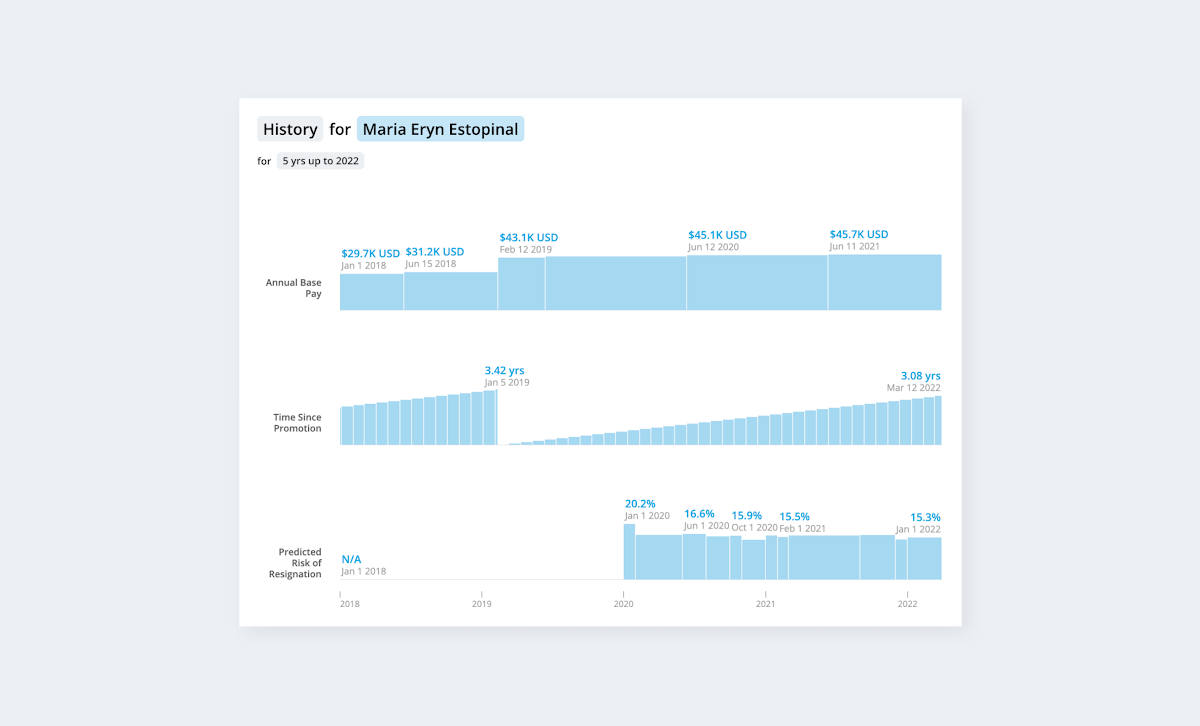
What has happened in this person’s career at our organization? What events could be impacting her risk of exit?
The chart above shows us where an individual has been in her career journey at the organization, while the one below shows where others like her have gone. Using this information together will help start career progression discussions.
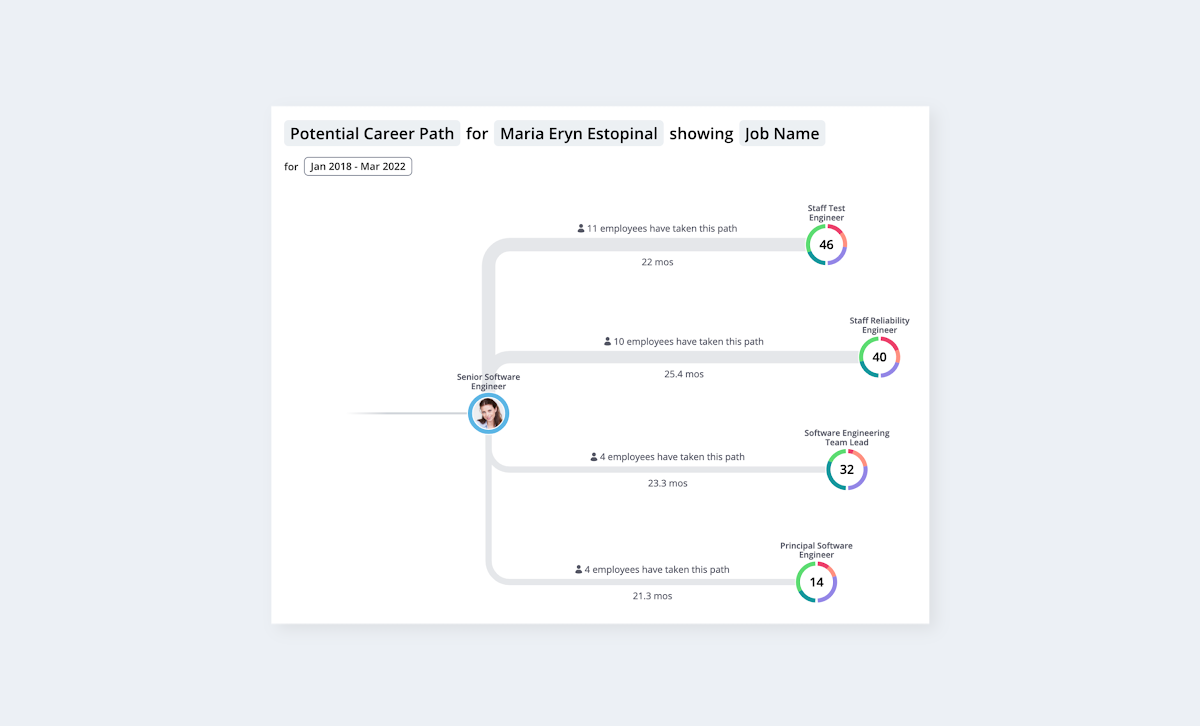
Knowing where others in similar roles have been promoted to will suggest career progression risks for individuals.
People analytics enables strategic business conversations
Ultimately, any set of tools should be about empowering the people analytics experts to have strategic conversations about what’s happening in the organization and what actions will head off problems. True people analytics is about insights which enable better business decisions, not merely better charts and reports available from an HR dashboard.
Dashboards are necessary, but insufficient by themselves. Visier doesn’t just build a better dashboard—with Visier your leaders, managers, and HR go beyond the dashboard to understand what’s happening, what’s going to happen, and offer insight on proactive steps. The entire conversation around people data changes instantly. Making better decisions with insight and foresight requires more agility and flexibility than dashboards offer.
Interested in learning more about Visier? Get in touch with us for a demo!
